


 English
 日本語
日本語
Tuesday 21 February 2023
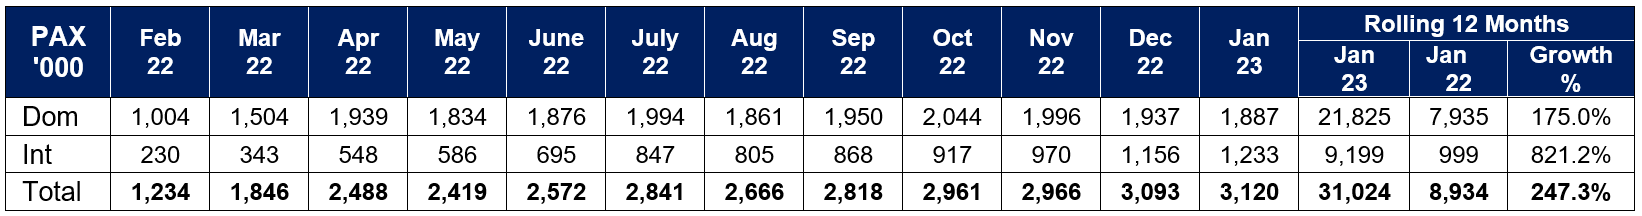
A total of 3,120,000 passengers passed through Sydney Airport in January 2023, representing a 78.8% recovery compared to pre-COVID January 2019.
Domestic passenger traffic totalled 1,887,000 in January 2023; an 82.4% recovery compared to January 2019.
1,233,000 international passengers passed through the airport in January 2023, representing a 73.9% recovery on January 2019 passenger traffic.

One year since Australia reopened its border to the world
On the first anniversary of Australia reopening its international border, Sydney Airport is reintroducing data showing the top 10 nationalities of passengers travelling through the airport each month.
In January, Australians travelling abroad took out the top spot, followed by New Zealanders, and U.S. passengers ranked third overall.

Sydney Airport CEO Geoff Culbert said: “It has been a challenging year for Sydney Airport since Australia reopened its border, but we are now seeing a steady stream of international travellers eager to explore the world again.
“While passenger numbers have increased since our border reopened, frustratingly the recovery is being impacted by the lack of capacity on key overseas routes.
“In January, the number of U.S and U.K. travellers was still only three quarters of what we saw pre-COVID, while the number of passengers from previously popular European countries like Germany and France was even lower.
“With the border to China reopening earlier this year, we anticipate the number of Chinese travellers to increase significantly throughout 2023, especially with more capacity returning to key routes.
“Australia also needs a sustained recovery in aviation capacity to support the recovery of key export markets including high-value agriculture, business travel, and international students.”
1. Due to data availability, all international passenger numbers (including PCP, prior corresponding period comparisons) are based on Confirmed Airline Passenger (CAP) data. As per previous information releases, these figures may contain estimates with any adjustments to preliminary statistics included in the year-to-date results in future months
2. Includes Domestic-on-Carriage
3. All data is for arriving and departing international passengers. All data is taken from management accounts, is provisional and subject to revision. All data has been rounded to the nearest thousand and in some instances the total may not be equal to the sum of the parts. Percentage changes have been calculated based on actual figures